How to Interpret Data from Your Soil Moisture Sensor
The ALTA Soil Moisture Sensor measures soil water status in centibars (cb) or kilopascals (kPa) of soil water tension. This value represents the energy a plant’s root system uses to draw water from the soil. As you analyze and interpret your sensor readings, you gain a clearer view of what is happening with the soil moisture in your crop’s root system.
Typically, two to three readings between irrigations are sufficient. Charting your readings will show precisely how quickly (or slowly) your soil moisture is being depleted. Our iMonnit Software can provide graphical displays of sensor data, so you know what’s happening throughout your precision irrigation operations.
Use the following readings as general guidelines:
- 0-10 cb (kPa) = Saturated soil
- 10-30 cb (kPa) = Soil is adequately wet (except coarse sands, which are beginning to lose water)
- 30-60 cb (kPa) = Usual range for irrigation (most soils)
- 60-100 cb (kPa) = Usual range for irrigation in heavy clay
- 100-200 cb (kPa)* = Caution: soil is becoming dangerously dry for maximum production. Proceed with caution.
*1 ALTA Soil Moisture Sensors read up to 240 cb (kPa).
Your situation may be unique because of differences in crops, soils, and climate. Perhaps the most crucial soil moisture reading is the difference between today’s reading and that of three to five days ago. That is to say, how quickly is the reading going up? A slow increase means the soil is drying out slowly. But a big jump means the soil is losing water very rapidly. A faster rate of increase means the crop is working harder to extract water from the soil and may start to stress. By analyzing such trends in the readings, you will determine when to irrigate. Displaying readings on a graph makes it easier to see the trends, thereby making interpretation easier.
Assessing Soil Moisture Thresholds
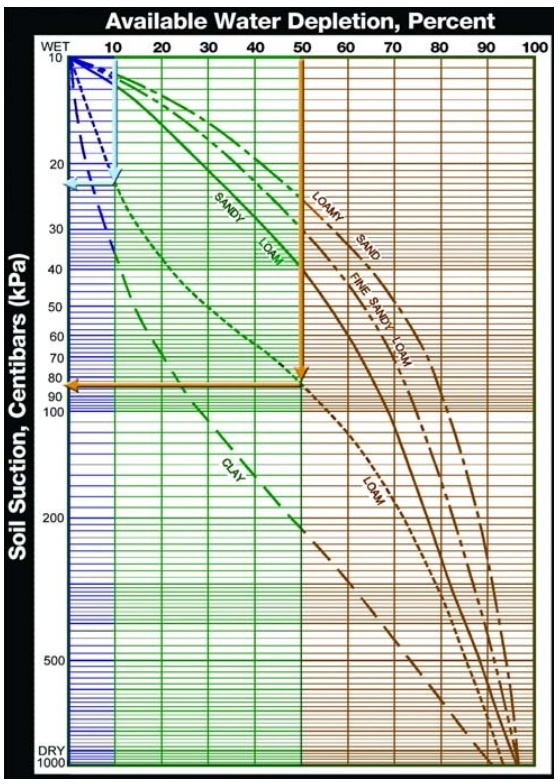
This graph can assist you in creating reference points for your site and application. These points help identify the boundaries within which you want to manage moisture availability for your crop. How wet and dry the soil should depend on soil type, crop, the plant’s stage of development, and cultural practices for managing the field. A chart or graph like this can help guide you to select appropriate threshold levels.
- Select the soil type(s) that most closely resembles that in your field.
- Draw a vertical line from 10% available water depletion (represented by the blue/green boundary) down to the curve for your soil type and then horizontally over to the left axis labeled soil suction to obtain the wet reference value. This will help you determine the lower (wetter) threshold value.
- Use this centibar / kPa value as the wet threshold. For example, for loam soil, this value would be 23 (as indicated by the blue arrow).
- Draw a vertical line from 50% available water depletion (represented by the green/brown boundary) down to the curve for your soil type and then horizontally over to the left axis labeled soil suction to obtain the reference dry value. This will determine the higher (drier) threshold value.
Use this centibar / kPa value as the dry threshold. For example, for loam soil, this value
would be 84 (as indicated by the brown arrow).
Further Reading
How the Soil Moisture Sensor Works
How to Install the Soil Moisture Sensor
Soil Moisture Sensor Installation by Crop Type